Image Classification
Your goal is to build a system that recognizes the object present in an image. You are given a set of training images, where each image is of size 231x231, can be either color or grayscale, and has an associated label $y$.
There are three kinds of objects:
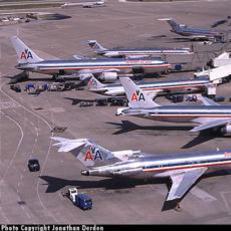
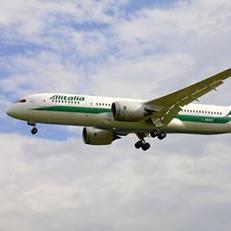
- Airplane
- Car
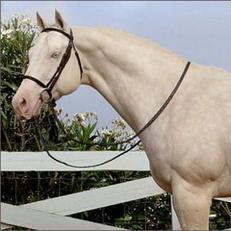
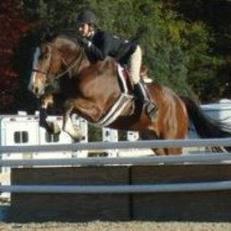
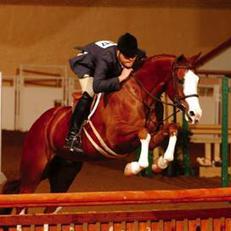
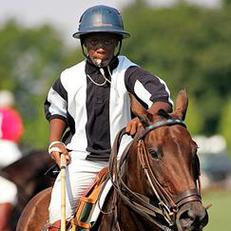
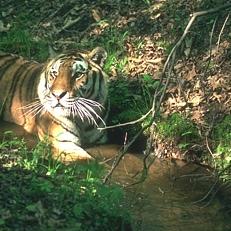
- Horse
for which we set $y=1,2,3$ respectively. There are also images that contain none of these objects, for which $y=4$.
Examples are shown below:
| Horse | 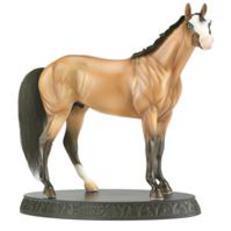 |
 |
 |
 |
 |
|---|---|---|---|---|---|
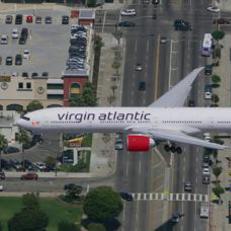
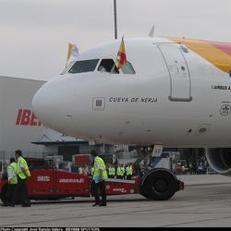
| Airplane | 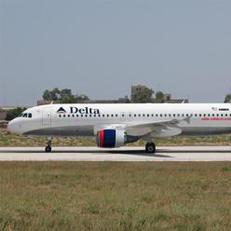 |
 |
 |
 |
 |
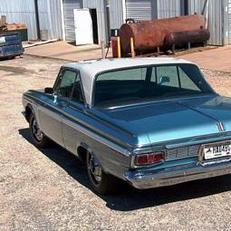
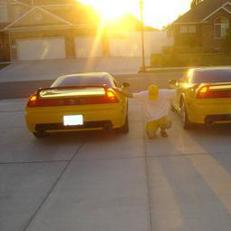
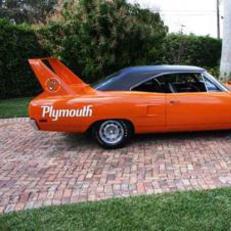
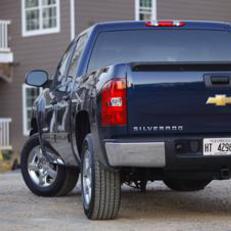
| Car | 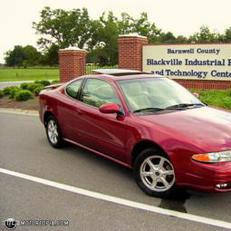 |
 |
 |
 |
 |
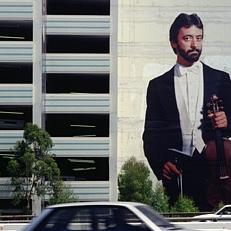
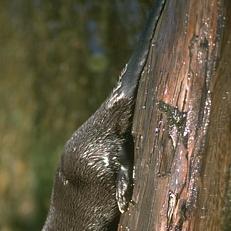
| Other | 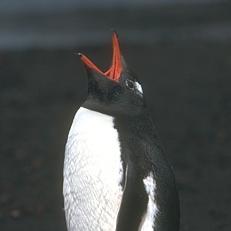 |
 |
 |
 |
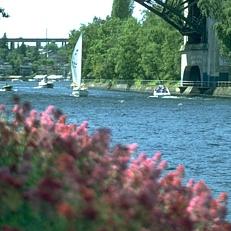 |
Note that the object may not be completely inside the image, but the algorithm should predict its presence if there is enough evidence.
For this dataset, we also provide you with two sets of features. The provided features are:
- Histogram of Oriented Gradients (HOG): These are features used for many tasks in computer vision, such as object and pedestrian detection. The HOG features were generated with Piotr's toolbox (alternate download link). To find more information about HOG features you can check Piotr's hog function help. It is also possible to visualize the extracted features with Piotr's hogDraw() function. This may be a valuable tool to understand what your classifier is learning from the HOG features.
- OverFEAT ImageNet CNN Features: These are features extracted from a Convolutional Neural Network (CNN) that was trained on the huge ImageNet database. For more details, check out the overFeat webpage.
To get started follow these steps:
- Download the data.
- Download the Deep Learning toolbox in the same folder as the data. Unzip it.
- Download imageClassificationExample.m in the same folder.
- Before running the demo, you need to add the toolboxes you downloaded to your path:
addpath(genpath('where/the/toolbox/is')) - Run imageClassificationExample.m to execute the demo.
Prediction Tasks
Your goal is to predict the following:- Binary prediction: In this task you need to predict whether test images contain an object in $\{Car, Horse, Airplane\}$ or not. This is equivalent to grouping classes $1,2,3$ into a single class we call 'positive', and the 'negative' class being class $4$. Given a test image, you will predict whether it belongs to the 'positive' or 'negative' class.
- Multi-class prediction: In this task you need to predict the type of object present in a test image. i.e., given a test image, predict $y \in \{1,2,3,4\}$.
Performance Evaluation
In computer vision applications (and in many other domains), standard performance measures such as the 0-1 loss may not be a good indicator of a good performance.
E.g. you can see that there is a problem with the 0-1 loss if you have 90% of negative samples and 10% of positive ones. Predicting all samples as negatives will already give you 10% error, which may appear very good but is not.
Many measures can deal better with such problems. In this project we will use the Balanced Error Rate (BER), computed as:
$\displaystyle BER = \frac{1}{C} \sum_{c=1}^C \Bigg[ \frac{1}{N_c} \sum_{n=1}^N (y_n = c) (y_n \neq {\hat y}_n) \Bigg] $,
where $C$ is the number of classes, $N_c$ is is the number of examples in class $c$, $y_n$ is the ground truth for sample $n$ and ${\hat y_n}$ is its prediction. Understand this formula and why it is called the Balanced Error Rate. What would happen if you apply the BER to the 90%-10% problem described above?
Also think about how you can take into account class imbalance during learning, and avoid being biased by the large difference in number of samples between classes in the training data.
What to Report
You MUST use BER as the performance criterion for evaluation for both the binary and multiclass tasks.
To help you analyze the results you can take a look at the error rates for individual classes, and visualize the images that are being misclassified. This could help you understand why and where your method is failing to predict the correct label.